
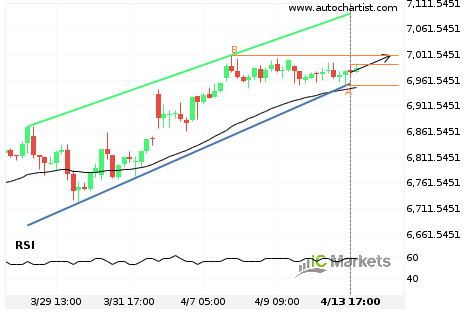
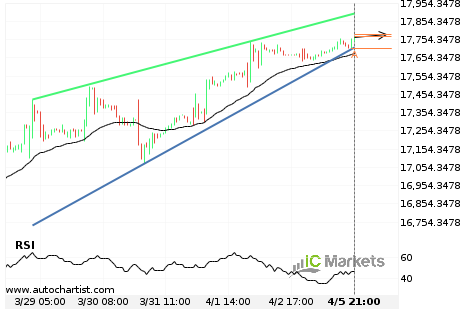
¿Tendrá el Australia 200 Index suficiente impulso como para irrumpir la resistencia?
El Australia 200 Index se dirige hacia la línea de resistencia de un Canal alcista y puede alcanzar este punto en las próximas 3 días. Ha probado esta línea ya en numerosas ocasiones en el pasado, y esta vez no tendría porqué ser diferente y terminar con una recuperación en lugar de una irrupción. Si […]
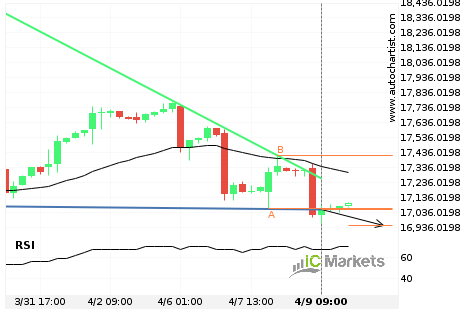
El comienzo de una tendencia bajista para el FTSE China A50 Index
El FTSE China A50 Index ha atravesado una línea de soporte de un patrón de gráfico que corresponde a un Triángulo descendiente. Si esta irrupción se mantiene, esperamos que el precio del FTSE China A50 Index pruebe el nivel de 16950.0066 dentro de las próximas 2 días. Pero no se apresure si desea operar, porque […]
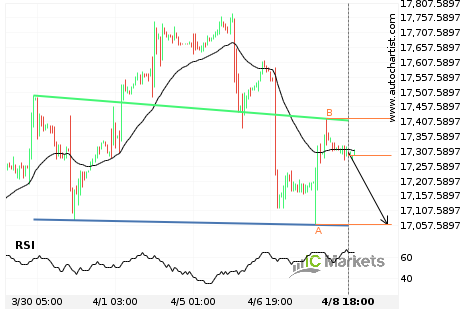
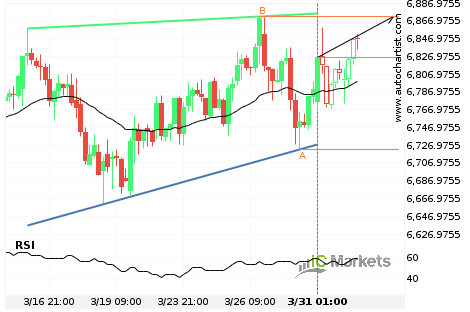
Irrupción inminente de el soporte por el FTSE China A50 Index
El FTSE China A50 Index avanza hacia la línea de soporte de un Hombro – cabeza – hombro, que ya ha probado varias veces en el pasado. Hemos visto un retroceso antes desde esta línea, así que en esta etapa no está claro si atravesará esta línea o se recuperará como lo ha hecho anteriormente. […]
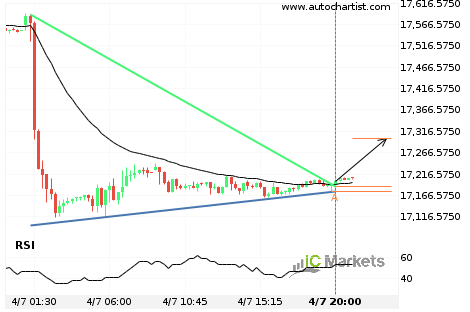
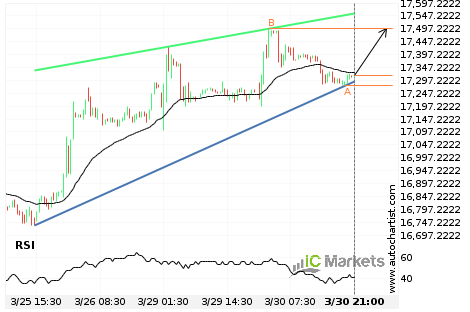
¿Se espera una tendencia alcista para el FTSE China A50 Index?
La irrupción del FTSE China A50 Index a través de la línea de resistencia de un Triángulo podría ser una señal de la ruta a seguir. Si esta irrupción persiste, esperamos que el precio del FTSE China A50 Index pruebe el nivel de 17299.1771 dentro de las próximas 5 horas. Debemos siempre ser cautelosos antes […]
Irrupción inminente de la resistencia por el FTSE China A50 Index
El FTSE China A50 Index avanza hacia la línea de resistencia de un Cuña ascendente, que ya ha probado varias veces en el pasado. Hemos visto un retroceso antes desde esta línea, así que en esta etapa no está claro si atravesará esta línea o se recuperará como lo ha hecho anteriormente. Si el FTSE […]
¿Tendrá el Australia 200 Index suficiente impulso como para irrumpir la resistencia?
El Australia 200 Index se dirige hacia la línea de resistencia de un Triángulo ascendente y puede alcanzar este punto en las próximas 2 días. Ha probado esta línea ya en numerosas ocasiones en el pasado, y esta vez no tendría porqué ser diferente y terminar con una recuperación en lugar de una irrupción. Si […]

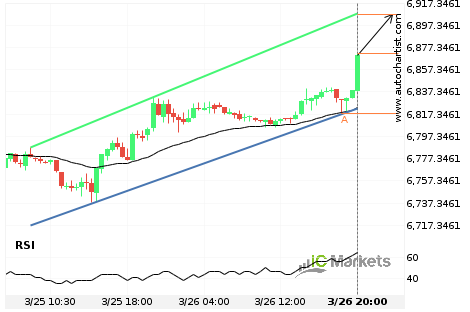
Irrupción inminente de la resistencia por el FTSE China A50 Index
El FTSE China A50 Index avanza hacia la línea de resistencia de un Triángulo, que ya ha probado varias veces en el pasado. Hemos visto un retroceso antes desde esta línea, así que en esta etapa no está claro si atravesará esta línea o se recuperará como lo ha hecho anteriormente. Si el FTSE China […]
¿Tendrá el FTSE China A50 Index suficiente impulso como para irrumpir la resistencia?
El FTSE China A50 Index se dirige hacia la línea de resistencia de un Cuña ascendente y puede alcanzar este punto en las próximas 21 horas. Ha probado esta línea ya en numerosas ocasiones en el pasado, y esta vez no tendría porqué ser diferente y terminar con una recuperación en lugar de una irrupción. […]
¿Tendrá el Australia 200 Index suficiente impulso como para irrumpir la resistencia?
El Australia 200 Index se dirige hacia la línea de resistencia de un Canal alcista y puede alcanzar este punto en las próximas 10 horas. Ha probado esta línea ya en numerosas ocasiones en el pasado, y esta vez no tendría porqué ser diferente y terminar con una recuperación en lugar de una irrupción. Si […]
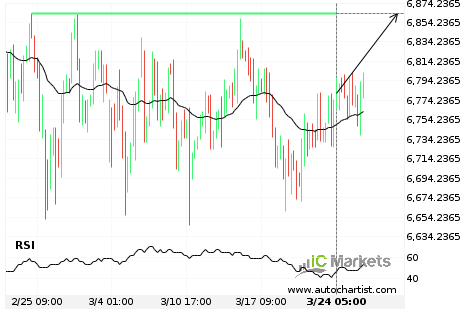
¿Deberíamos esperar una irrupción o una recuperación del Australia 200 Index?
El movimiento del Australia 200 Index hacia la línea de precio 6863.3599 es otra prueba más de la línea que ha alcanzado en numerosas ocasiones durante el pasado. Esperamos que esta prueba ocurra en las próximas 3 días, pero no sabemos si dará como resultado una irrupción a través de esta línea o simplemente una […]